Fern-nando: A Plant Monitor with Opinions
An ESP32-based plant monitor that tracks soil, light, and environment—and lets your plant complain about it.
Work in Progress
This post is an ongoing product design journey.
The Problem
My wife’s plants were dying.
Not in a dramatic way—just slowly, quietly, and consistently enough that it was clearly user error but hard to diagnose. Too much water? Not enough light? Bad vibes? Hard to say.
So naturally, I built a small embedded system to remove the guesswork. But the real problem is we just keep forgetting to take care of the plants.
The Idea
 A simple goal:
Measure the things plants care about, and make that information obvious enough that we actually use it. We kept Tamagotchi alive obsessively when we were kids. Lets bring that back.
That turned into:
- Soil moisture sensing
- Ambient light tracking (with daily accumulation)
- Temperature and humidity monitoring
- A small touchscreen dashboard
- A little animated face that reacts to plant health
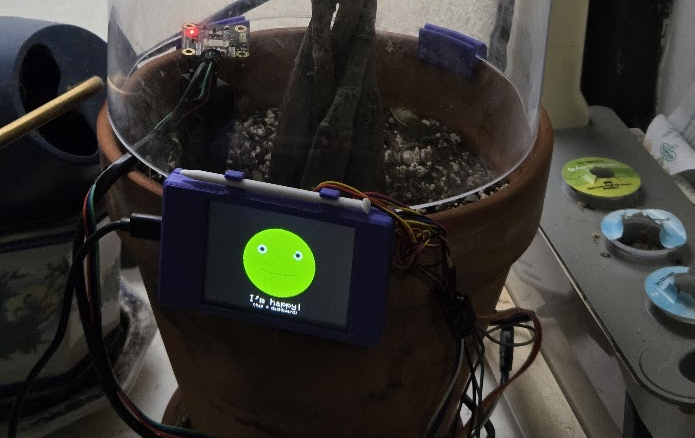
His name is Fern-nando.
Hardware
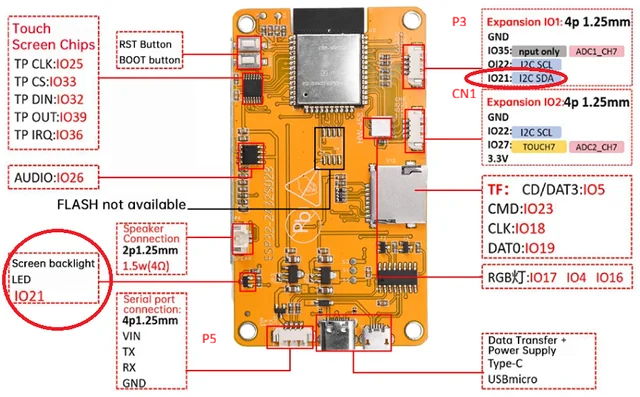
The system is built around an ESP32 CYD touchscreen board (“cheap yellow display”, powerful, and just enough I/O for this project).
Core components:
- ESP32-2432S028 (2.8” TFT touchscreen) “CYD”
- Capacitive soil moisture sensor (analog)
- DFRobot environmental sensor (temp, humidity, pressure, light, UV over I2C)
- Onboard RGB LED for quick status indication
Everything runs off wall power for now, though solar is on the list.
What It Measures
Rather than just raw numbers, the system tries to answer:
“Is this plant doing okay?”
- Water
- Capacitive sensor stuck in the soil mapped from dry → saturated and normalized to a percentage.
- Light
- Measured in lux and integrated over time into lux-hours, which is way more useful than a single snapshot.
- Environment
- Temperature
- Relative humidity
- (Pressure and UV are logged but not heavily used yet)
Turning Data Into Something Useful
 Raw sensor values are easy.
Interpreting them is the hard part.
Each metric gets mapped into a “good zone” using a simple trapezoidal scoring function:
- Too low → bad
- Ideal range → good
- Too high → bad again
Those scores roll up into an overall plant health value.
It’s not scientifically perfect, but it’s consistent—and that’s what matters.
The Interface
There are three main screens:
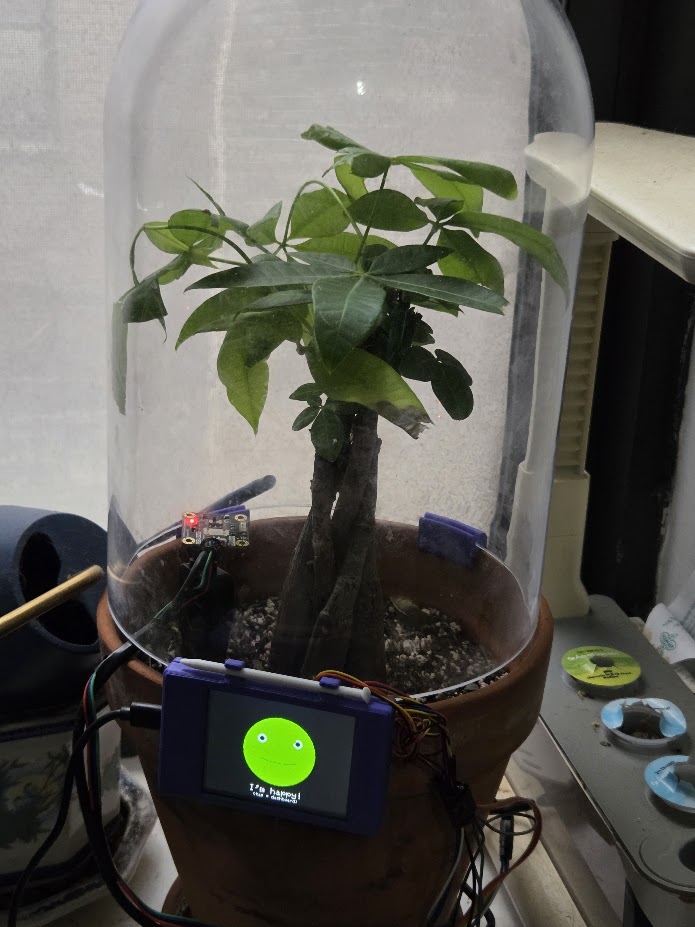
1. Face
A simple animated expression that reflects plant health.
- Happy when things are in range (And Green)
- Neutral when borderline (And Yellow)
- Sad (and occasionally sweaty) when things are off (And Red)
It blinks, looks around, and generally acts alive enough to get attention.
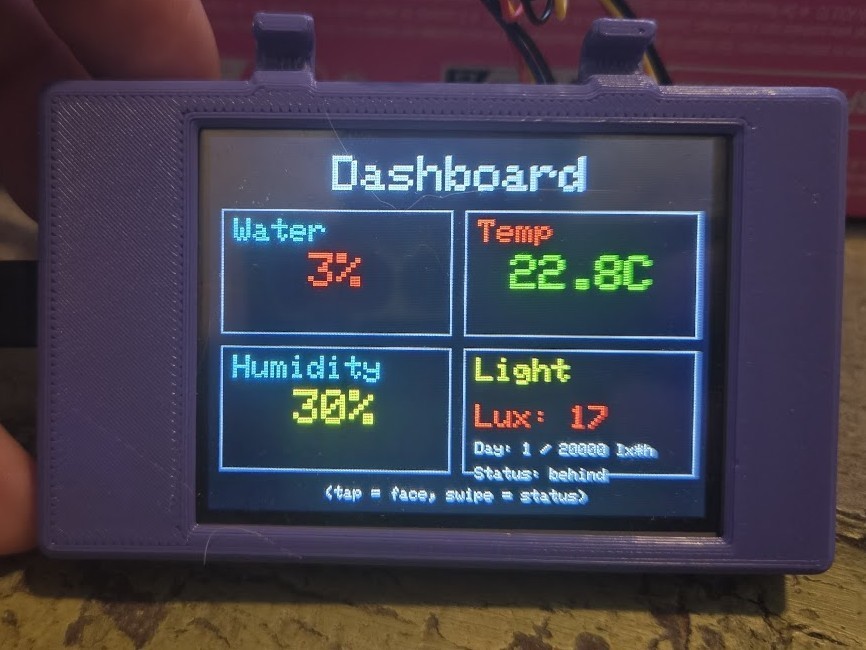
2. Dashboard
A 2×2 grid showing:
- Water
- Temperature
- Humidity
- Light
Quick glance, no thinking required.
3. Detail Views
Tap any tile to see a short history graph.
Enough to answer: “Is this getting better or worse?”
Data Logging + Web Interface
The ESP32 hosts a small web server that exposes:
- Live JSON state
- CSV logs
- Basic dashboard view
Everything is logged locally (SD card or LittleFS fallback), so it keeps working without WiFi.
What’s Next
- Solar power + battery
- Smarter watering recommendations
- Presence detection (wake screen when someone walks up)
- Cloud integration so Fern-nando can complain on the internet
This last item is what I’m most excited for. I already have an email for him. He is going to have a small local LLM speak for him and tweet and send emails. He is going to put himself on your calendar for watering. He will annoy you into keeping him alive.